Skip to content

eTools Markets

Commodity prices in one place

00_Load-Markets-Header

Follow and visualise spot and forward prices, without jumping between websites. For power, natural gas, CO2, oil and coal, across multiple countries.

Track. Analyse. Decide.

Built for experts

  • Energy-intensive industry
  • Retail & multi-site
  • Power producers
  • Energy suppliers

Built by experts

  • By portfolio managers & quantitative analysts
  • Across 27 countries

eTools Markets
key functions

01_Charts-Border

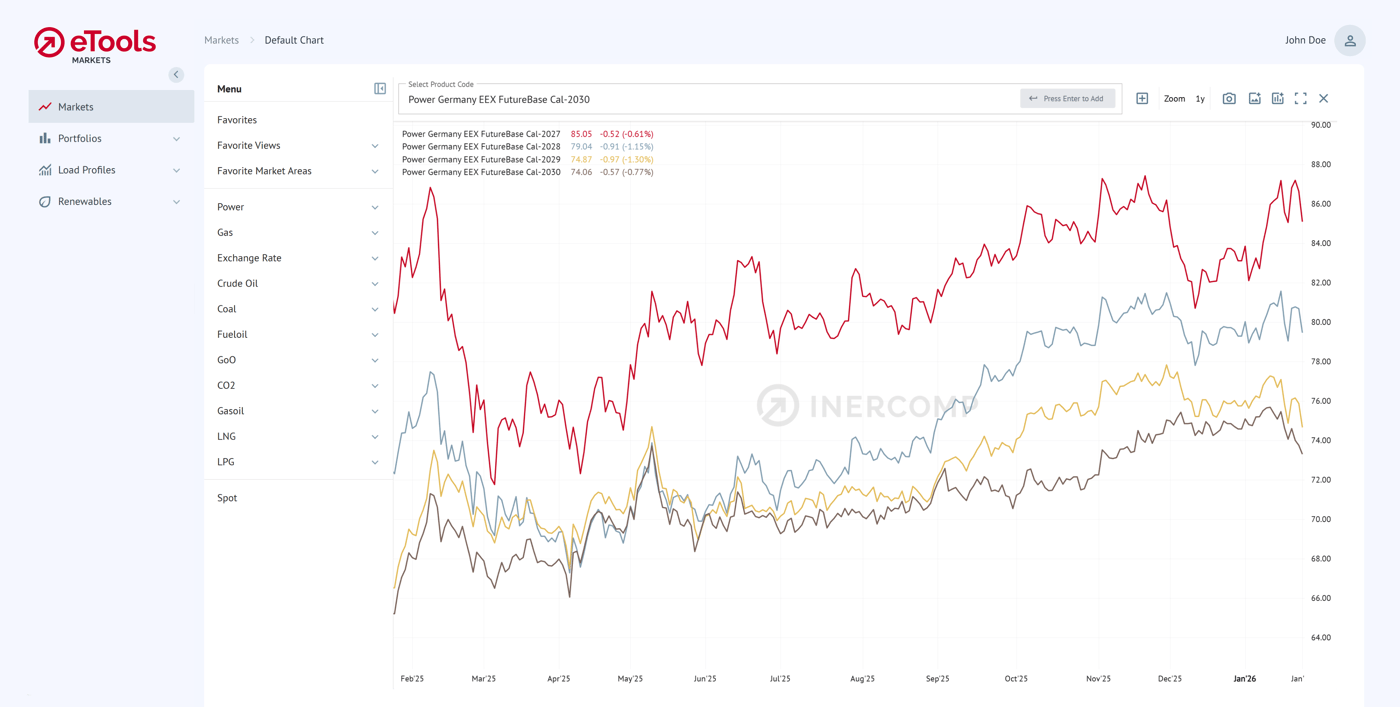
Visualise prices in one chart

Build clear charts with multiple price series, across delivery years or markets. Zoom in/out and use chart or table view. Export or pull data via API.

Save your favourite views

Create watchlists and save chart setups: markets, products, time range and indicators. Open your standard view in one click.
02_Favourites-Border
03_Spot-Border

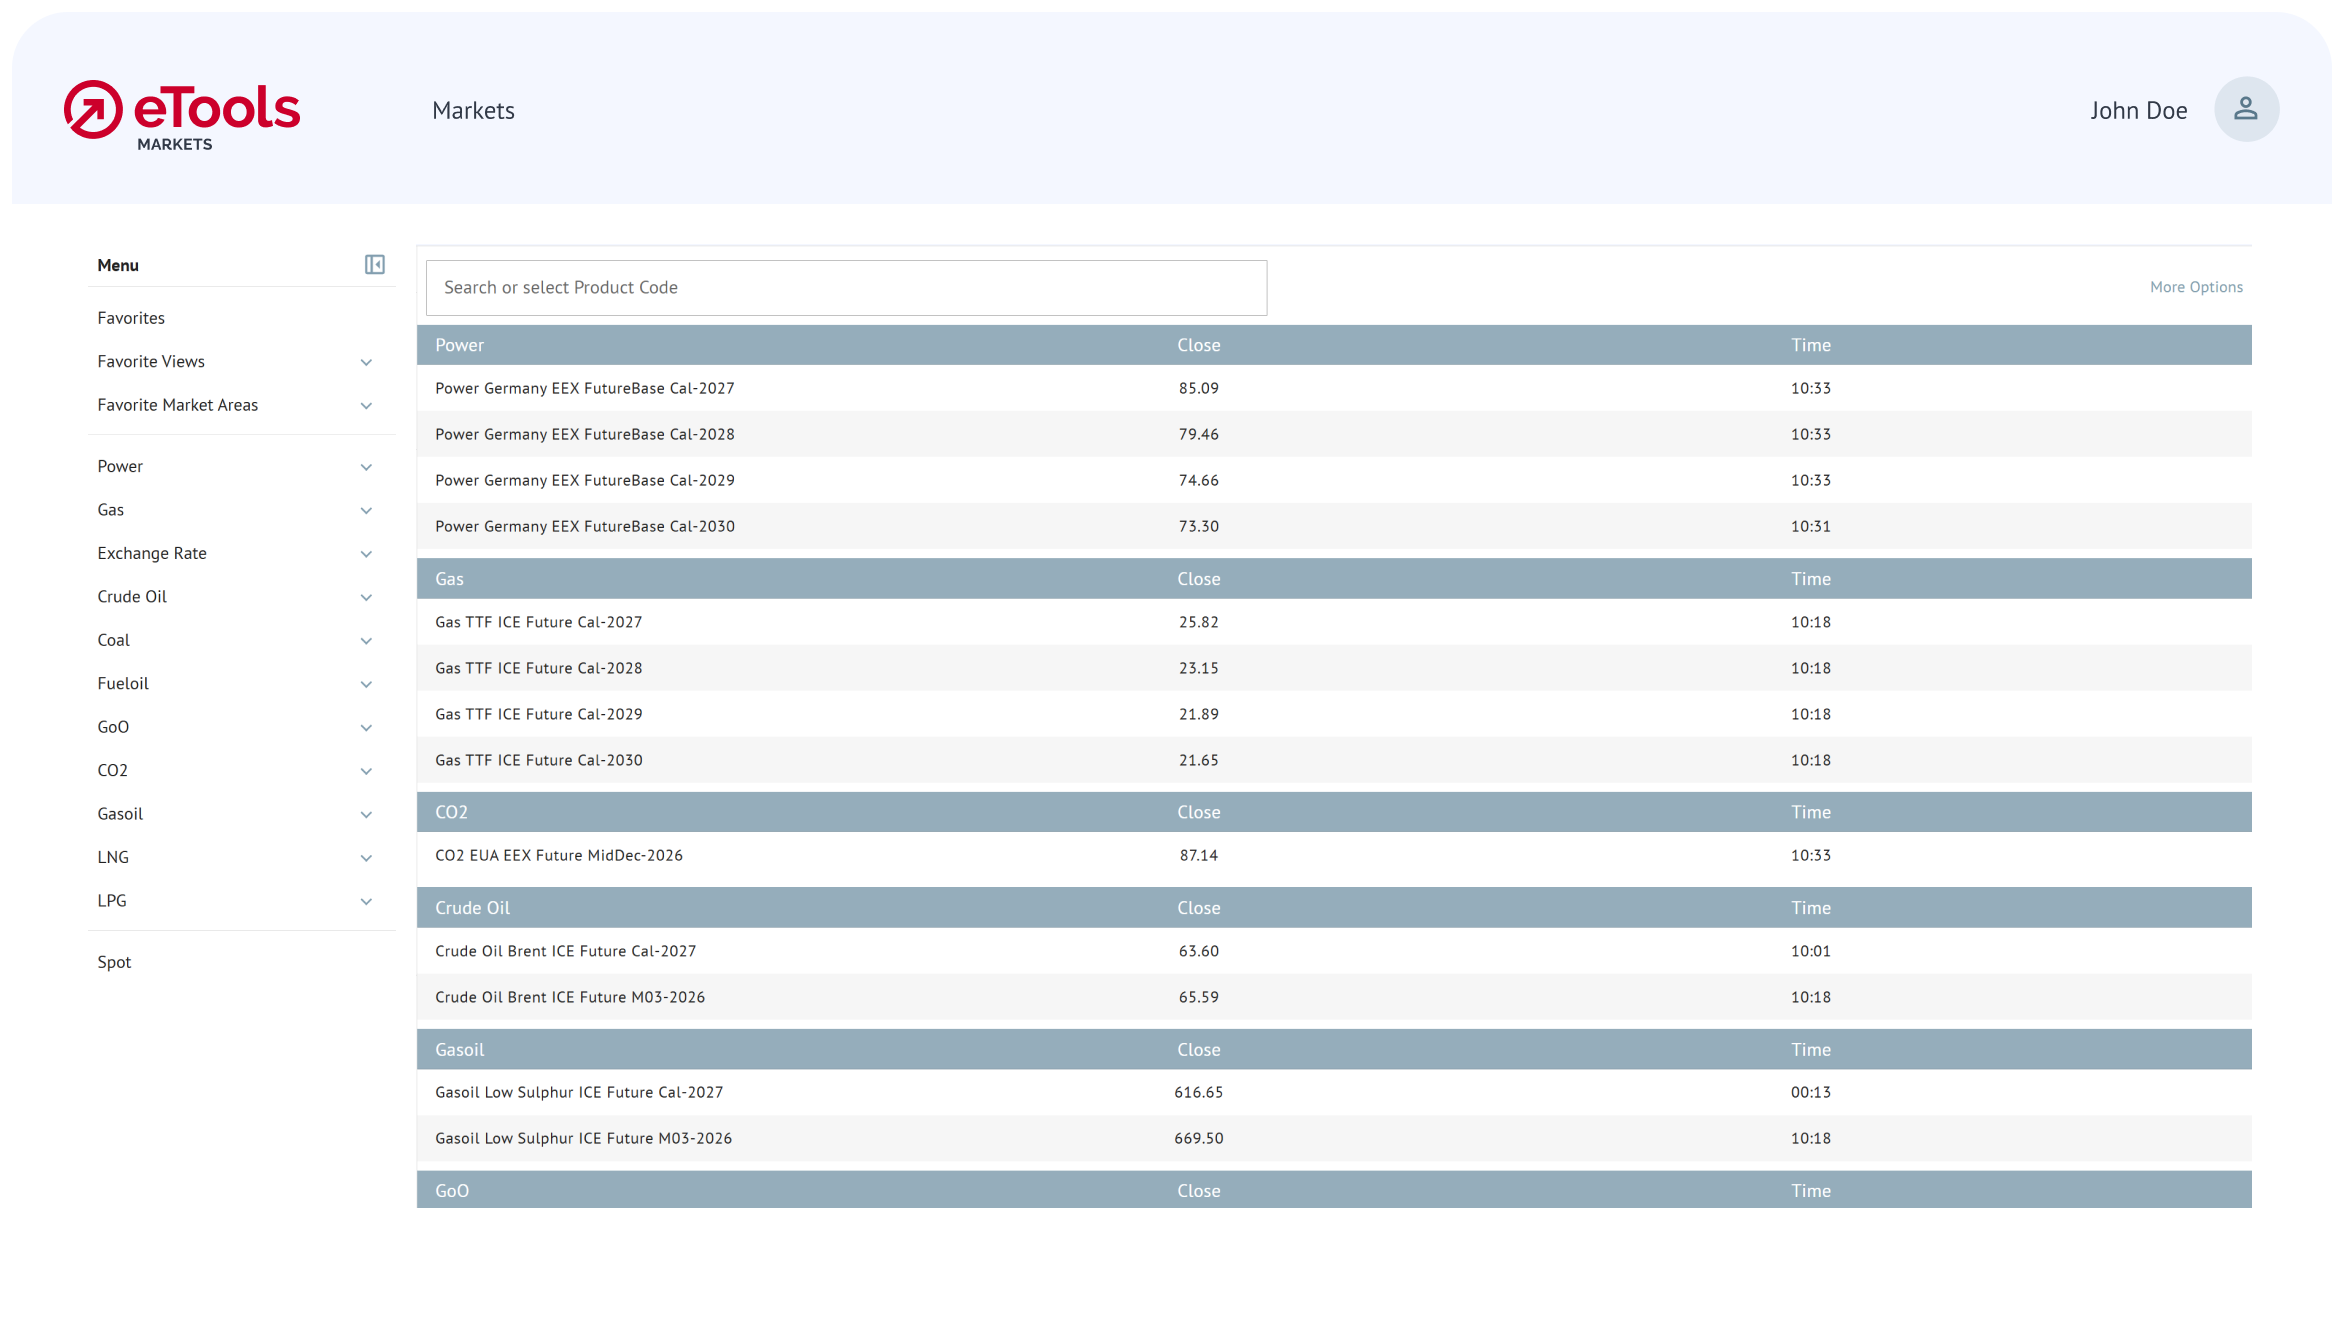
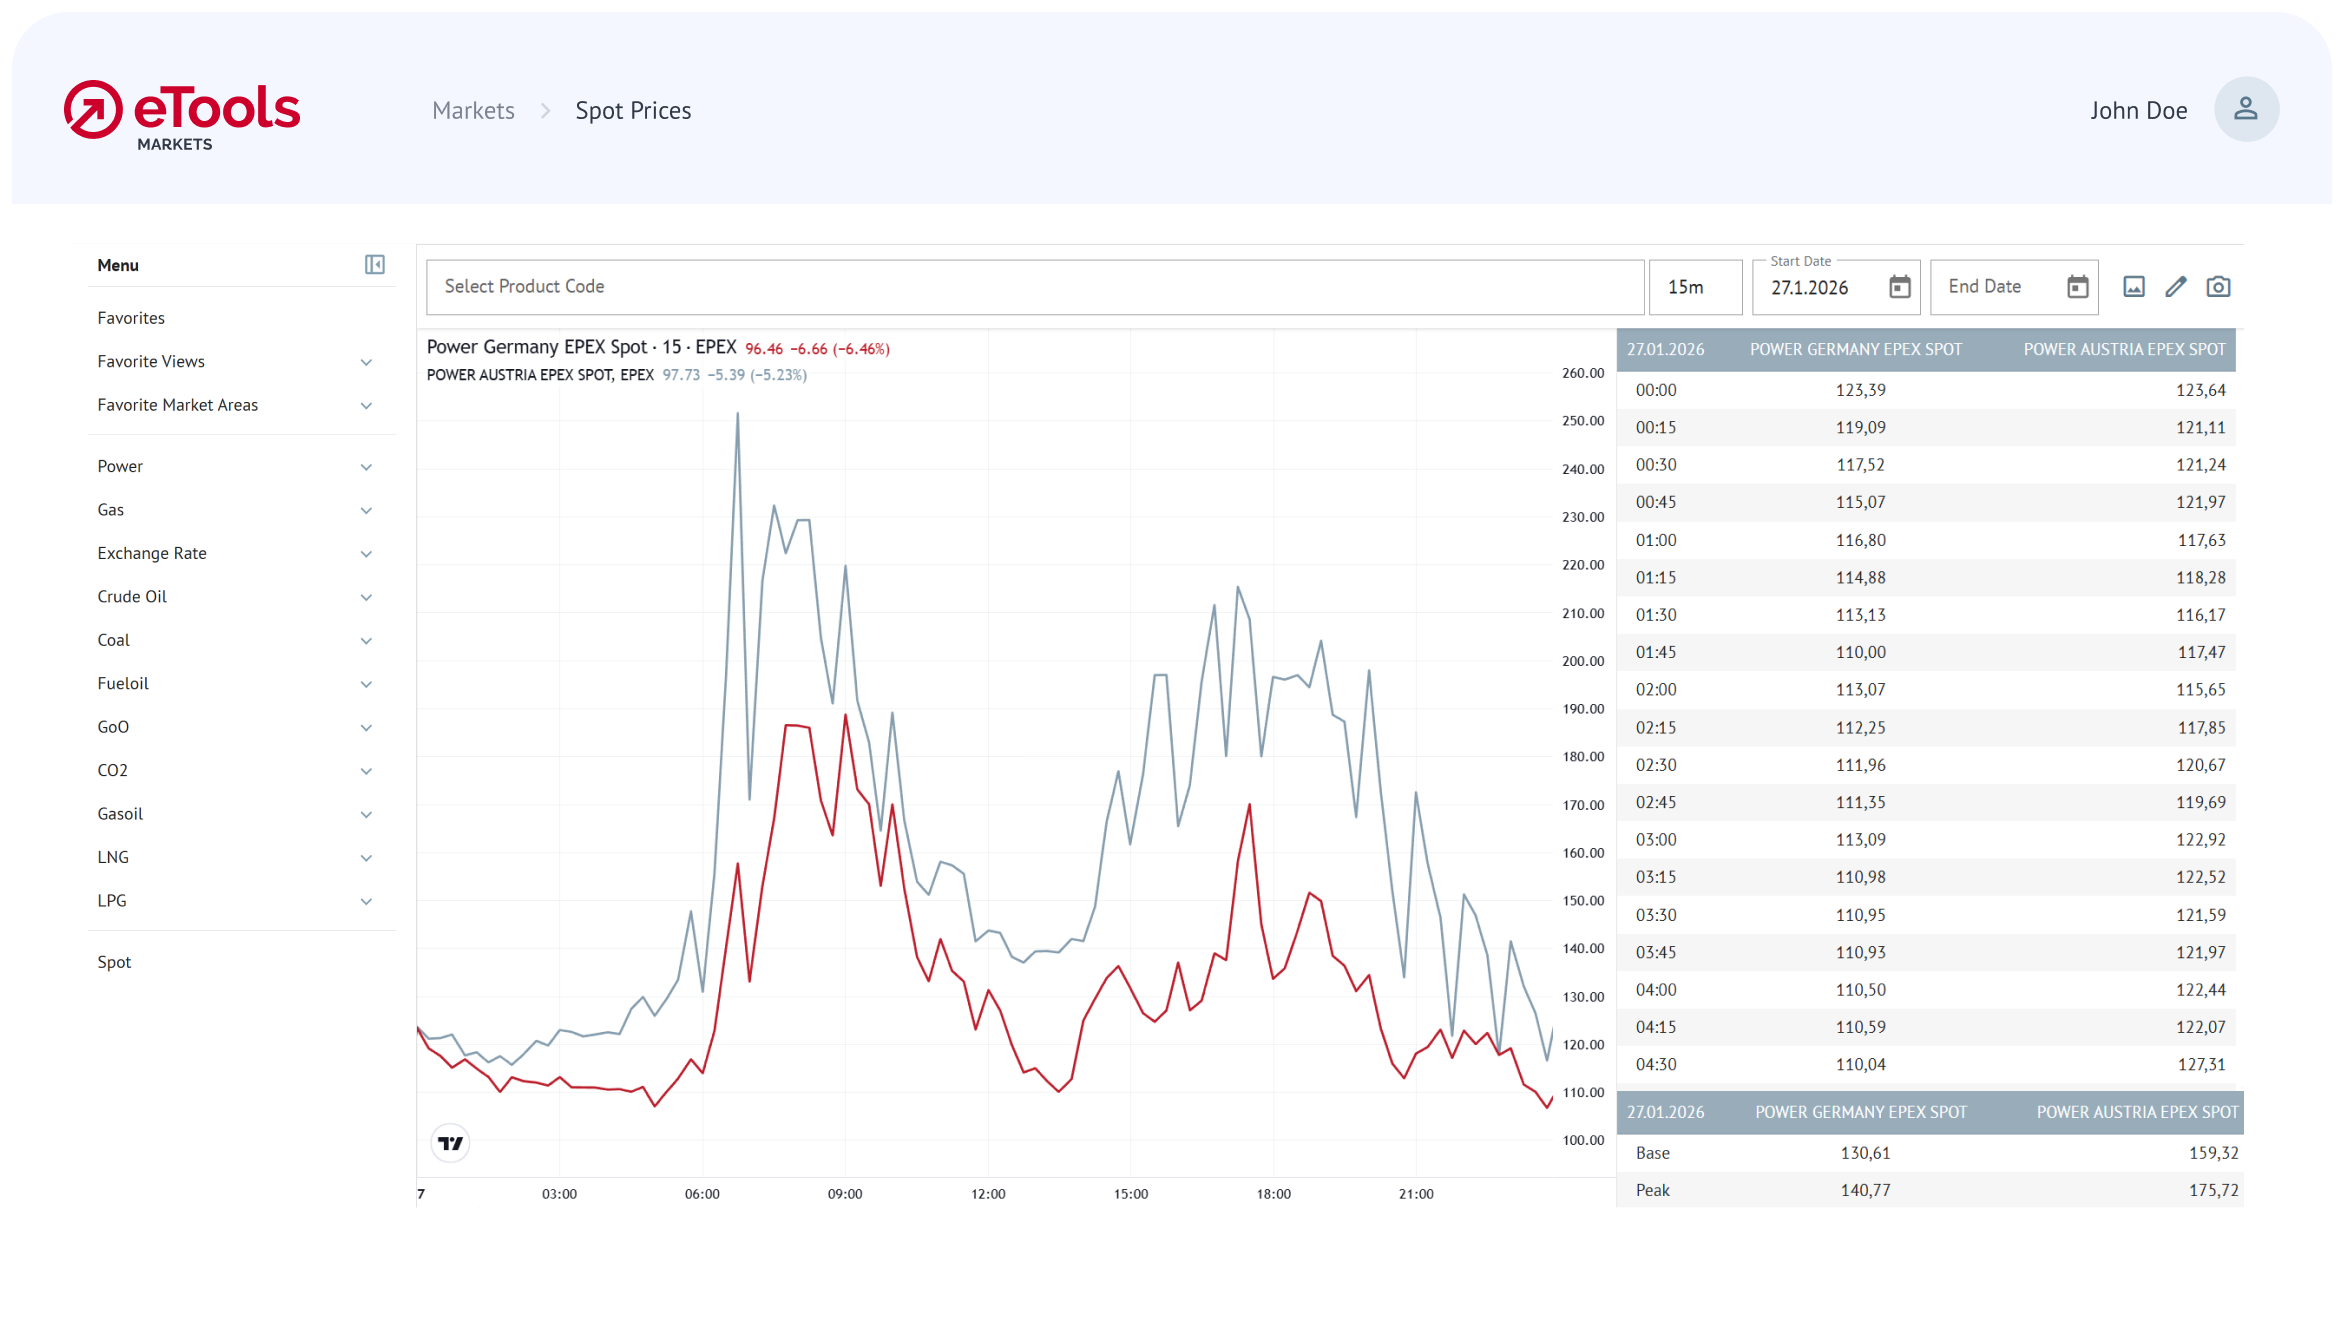
Track spot and forward prices

Follow spot and forward prices side by side: across Europe, for power, gas, CO2, oil and coal. See current level, last close and % change vs. the previous trading day.

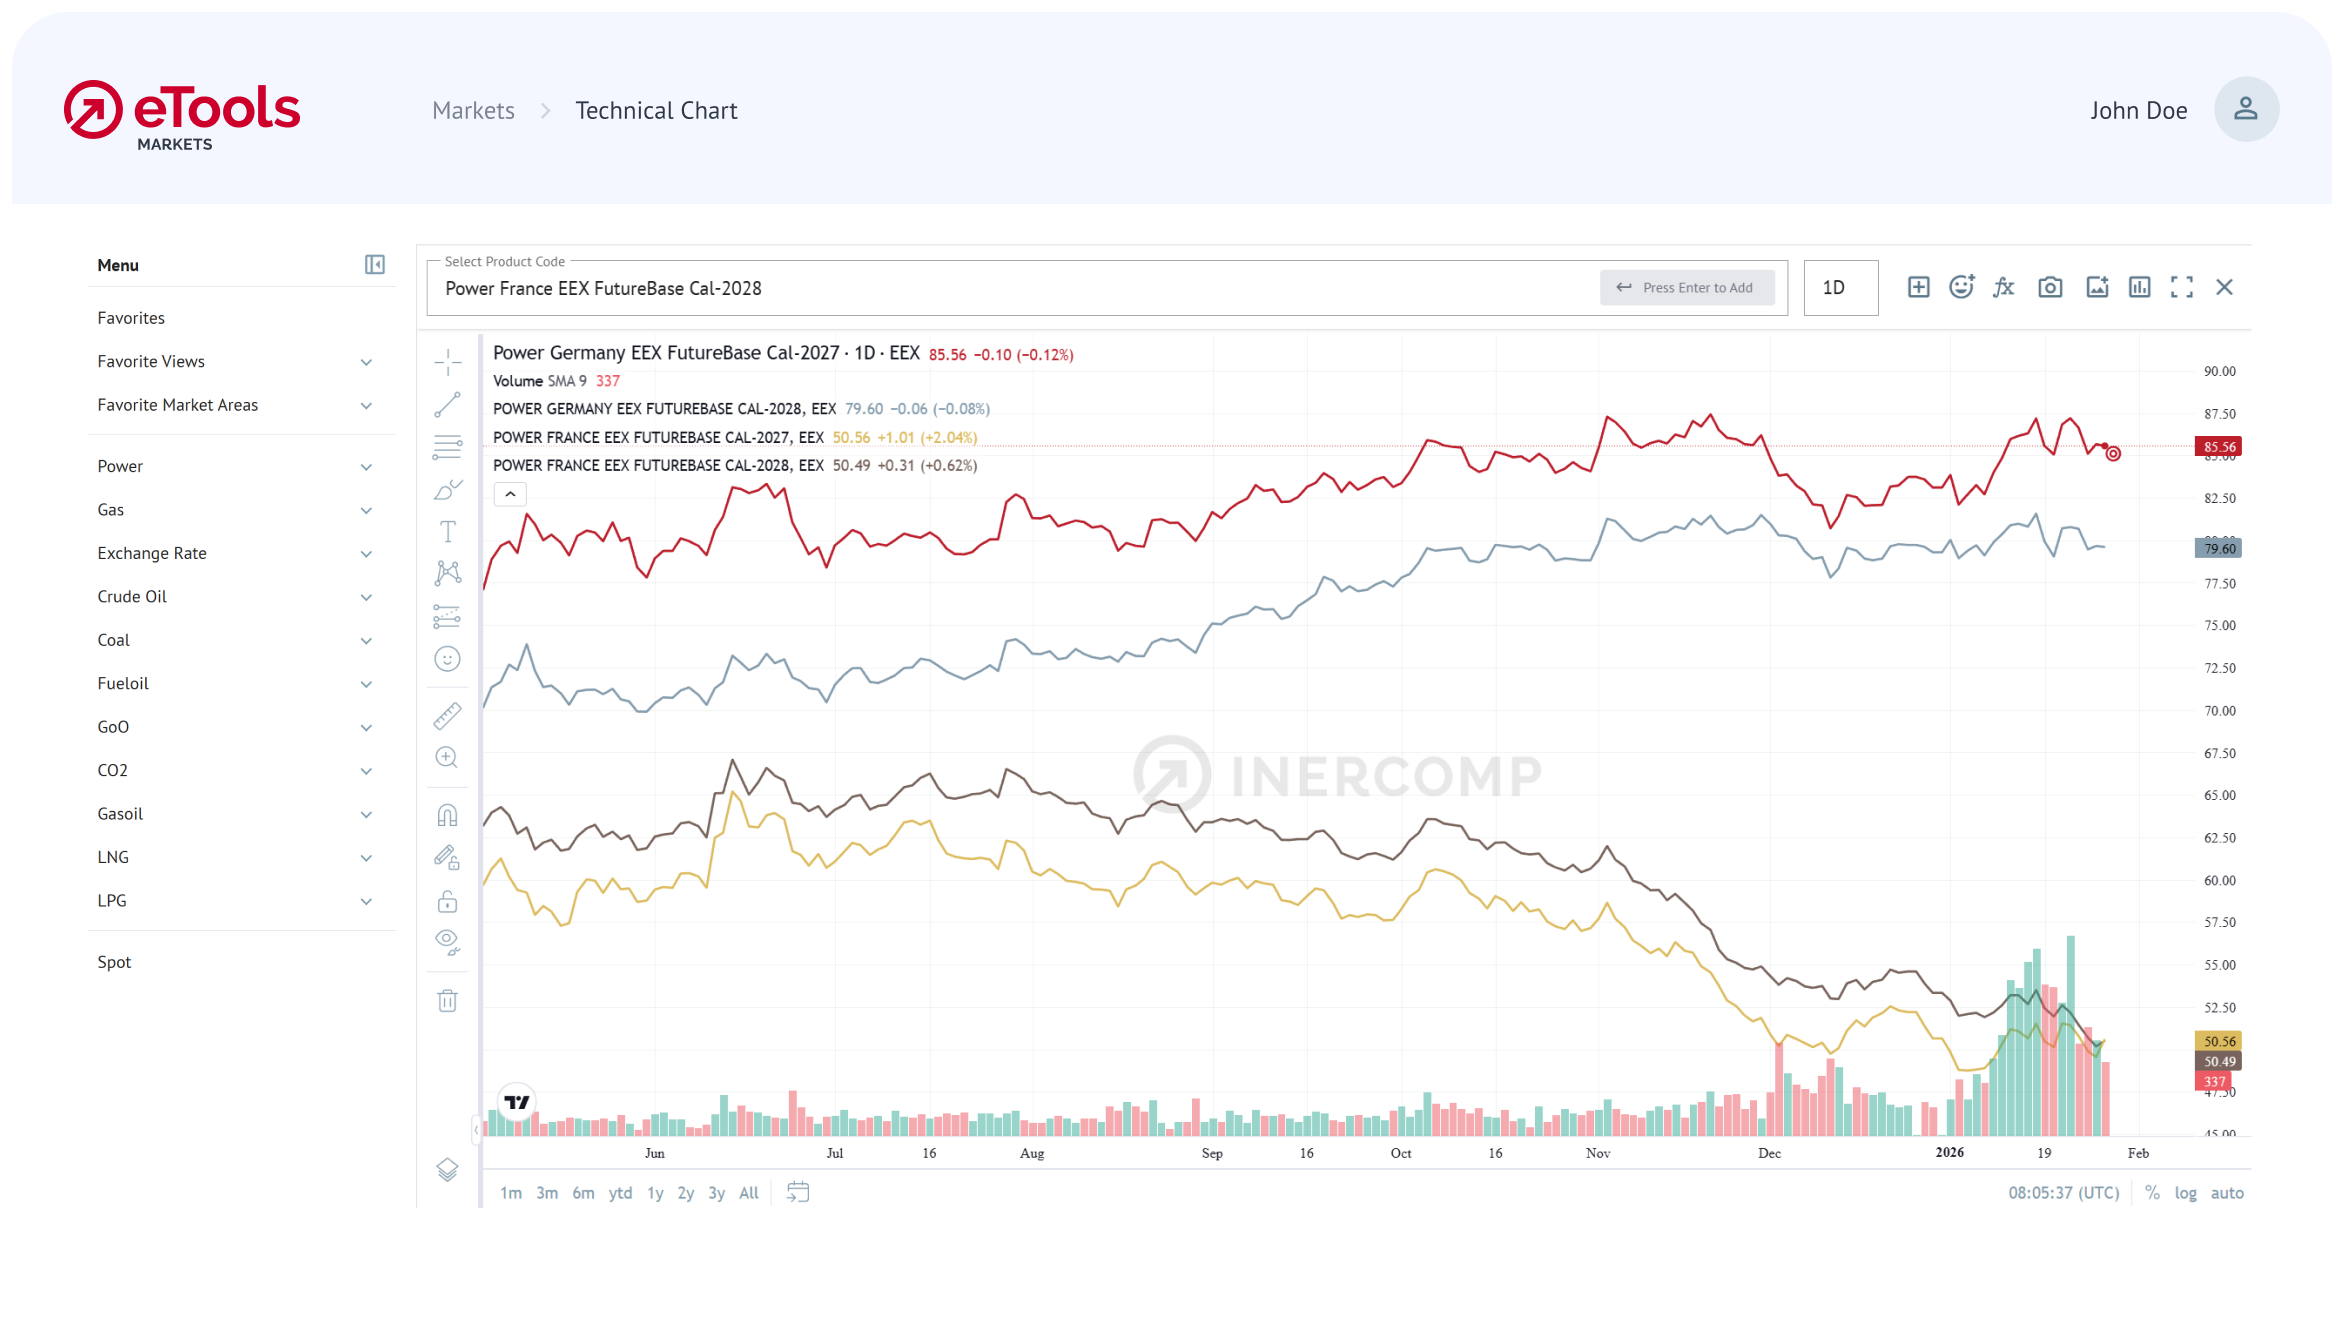
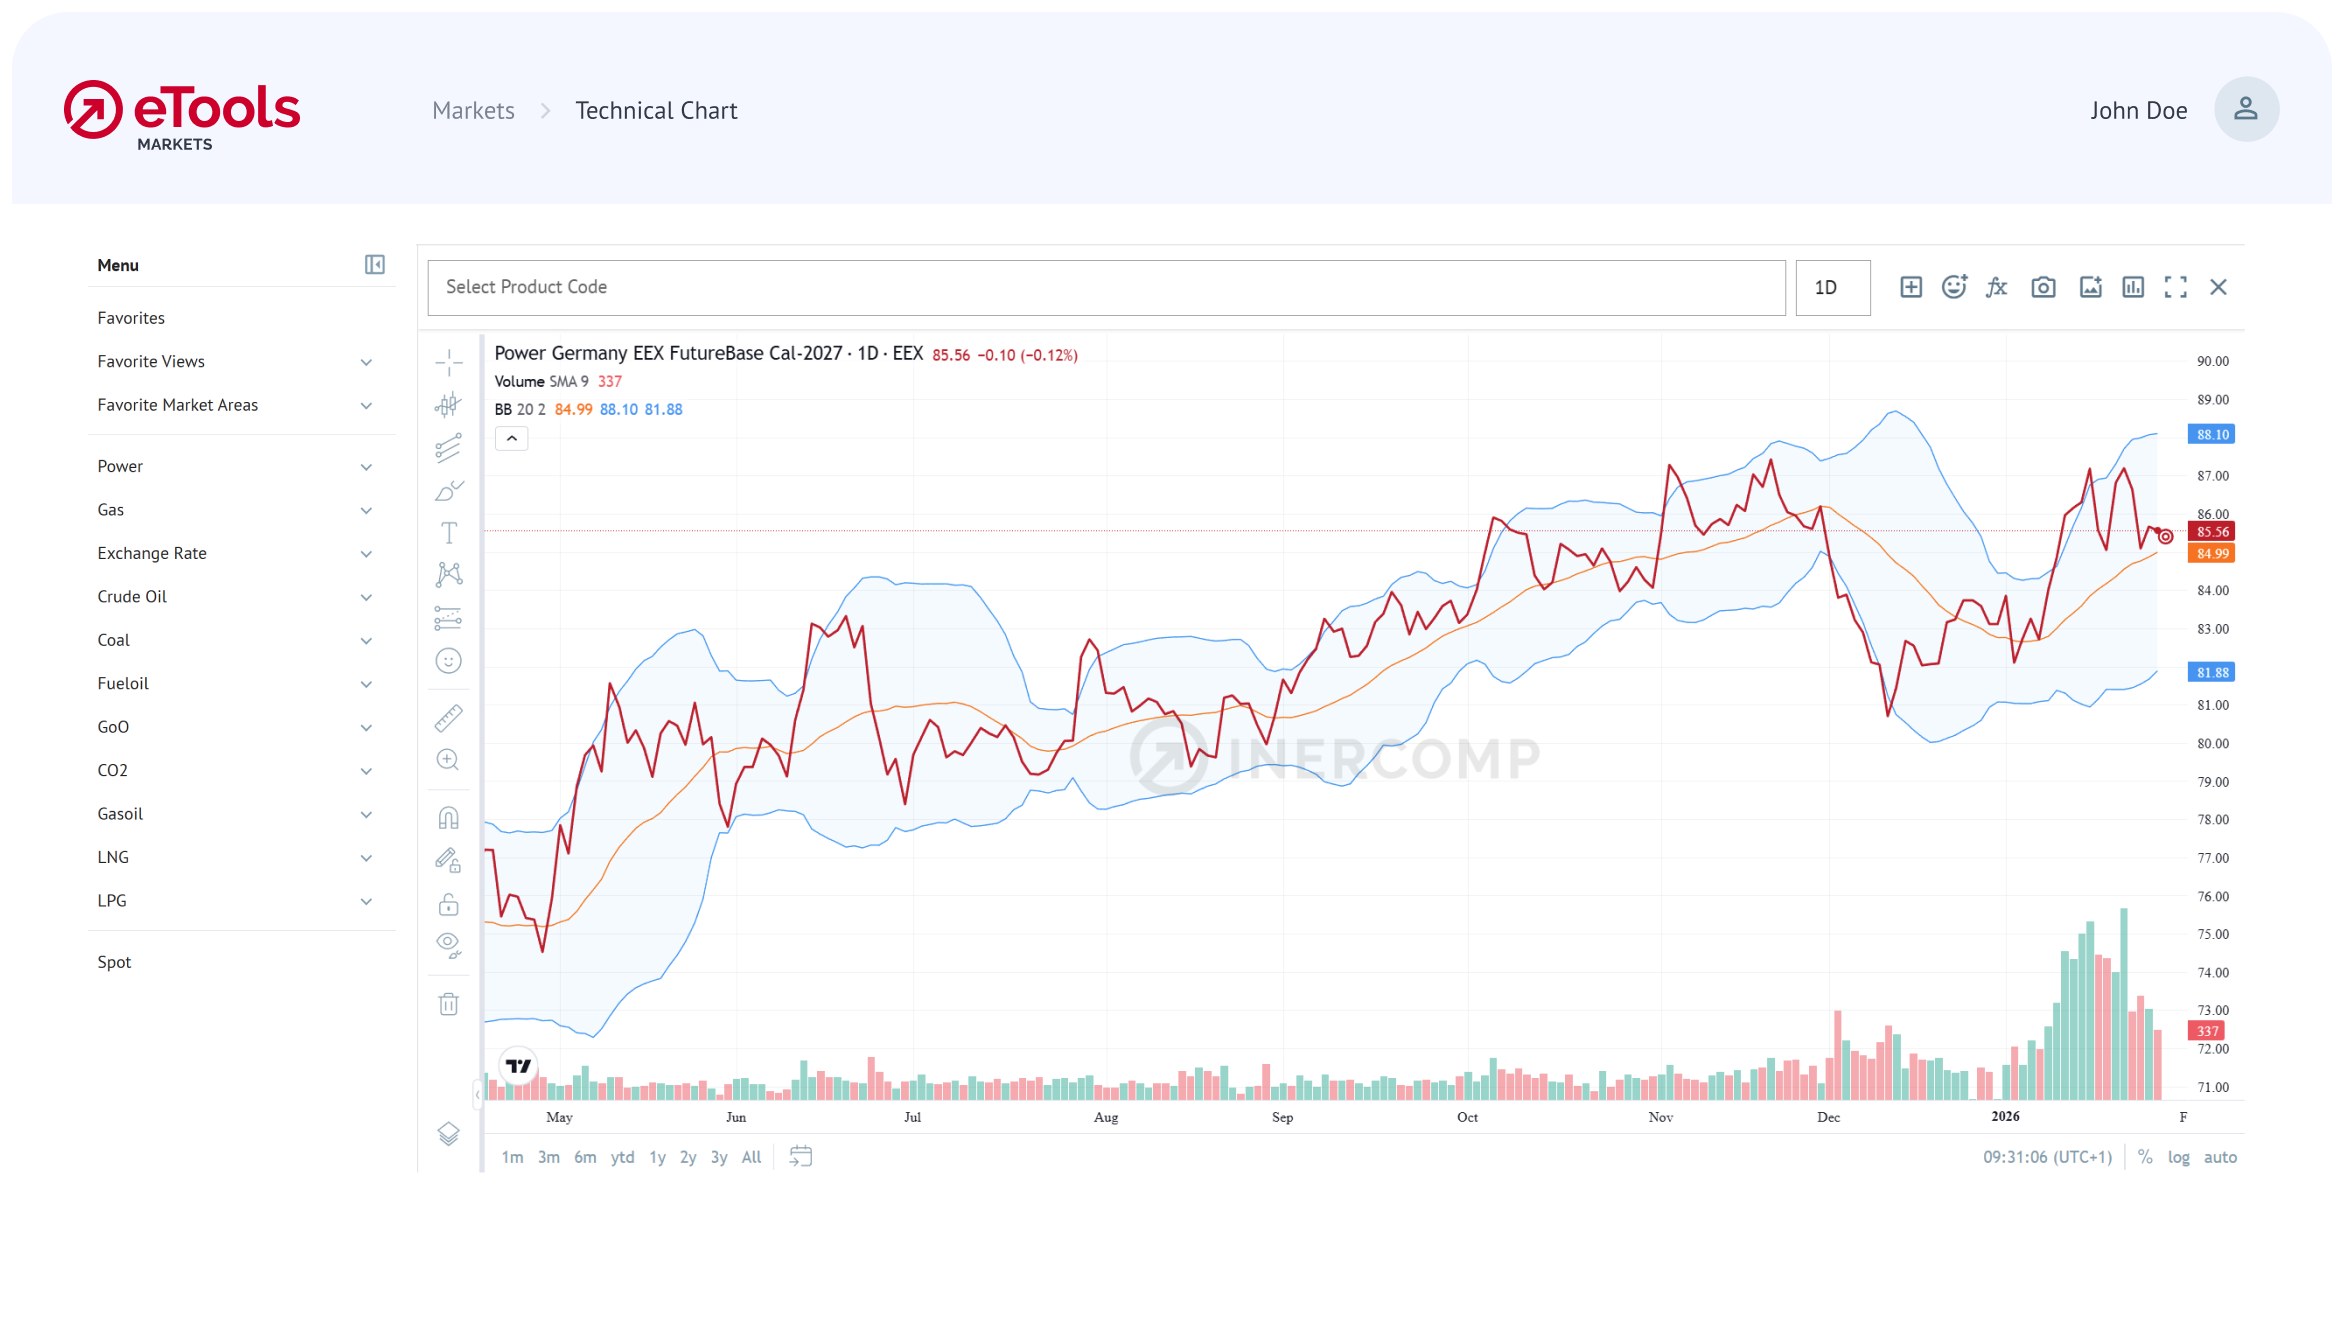
Add technical chart indicators

Include moving averages, RSI and more for extra context. Keep the view clean when you don’t need them.
04_Technical-Chart-Border
Data Feeder

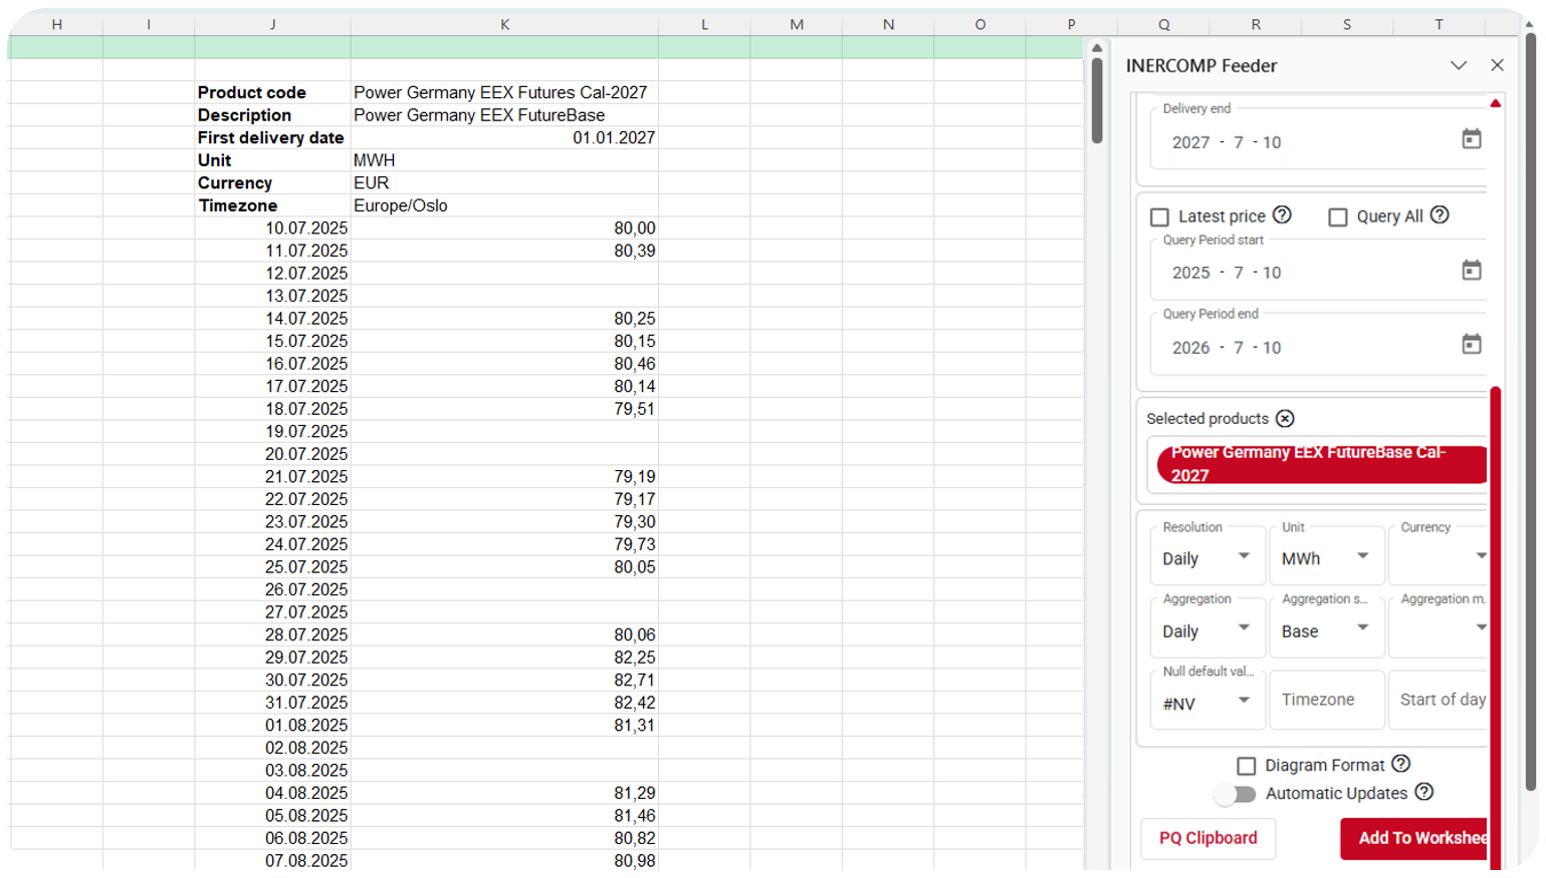
Load time series directly into Excel

The data feeder brings price series straight into your workbook: select market, product and time range, click and the values appear in the cells. No copy-paste. Alternatively, export views from the browser, connect your systems via API or use Power Query.

Your benefits

One place for
your key prices

  • Avoid switching between tools and formats.
  • Give your team access where they work: in the browser, in Excel or in their own system.

Fewer mistakes,
more confidence

  • Reduce manual effort and copy/paste errors.
  • Ground your hedging, pricing and internal reporting in clear market context.

Calm overview,
less noise

  • See what matters at a glance.
  • Focus only on relevant information and avoid data overload.

Ready for a deep dive?

Let’s discuss your use case and setup. See eTools examples and get answers to your questions in one session.

inercomp_etools_markets_logo_RZ-rgb

FAQ

  • Markets covers power, natural gas, coal, oil, CO2 and Guarantees of Origin (GoO), with spot and forward prices where available. The exact market list is shared in the demo/offer.

  • Yes, we cover both spot and forward prices for all price zones available.

  • Yes. API access is available for integration into BI or internal tools.

  • Yes. You can export PDF reports and a standard Excel file with all calculated time series.