Skip to content

eTools Renewables

Market value assessment

00_Header-Renewables

Know what your assets and PPAs are really worth. Defend your numbers when finance, management or your buyer challenges them, with a market view built on the recognised ICIS model and your own inputs. For solar, onshore and offshore wind, and hydro across Europe.

Back your business case.

Built for experts

  • Project developers & energy producers
  • Corporate off-takers of PPAs
  • Investors & financing institutions

Built by experts

  • By portfolio managers & quantitative analysts
  • Used in 25+ European countries

eTools Renewables
key functions

1_Calculate long-term capture rates and prices-Border

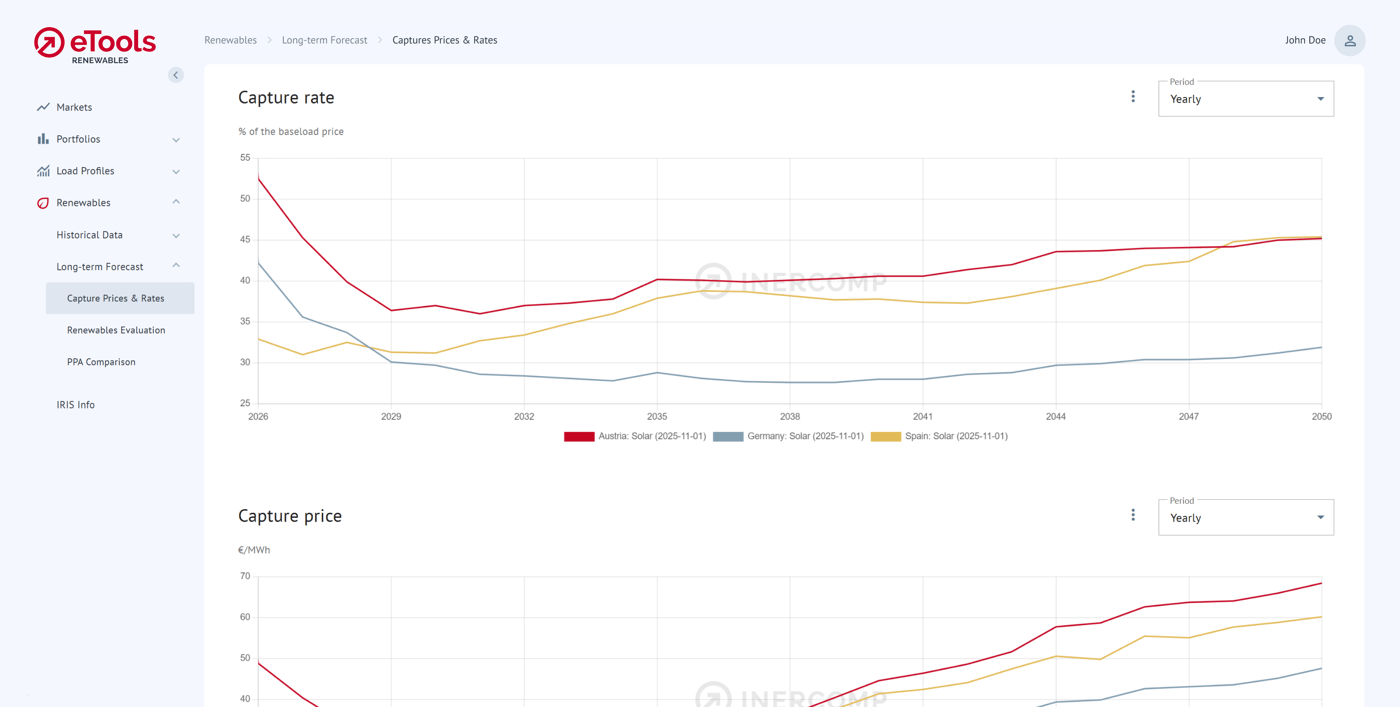
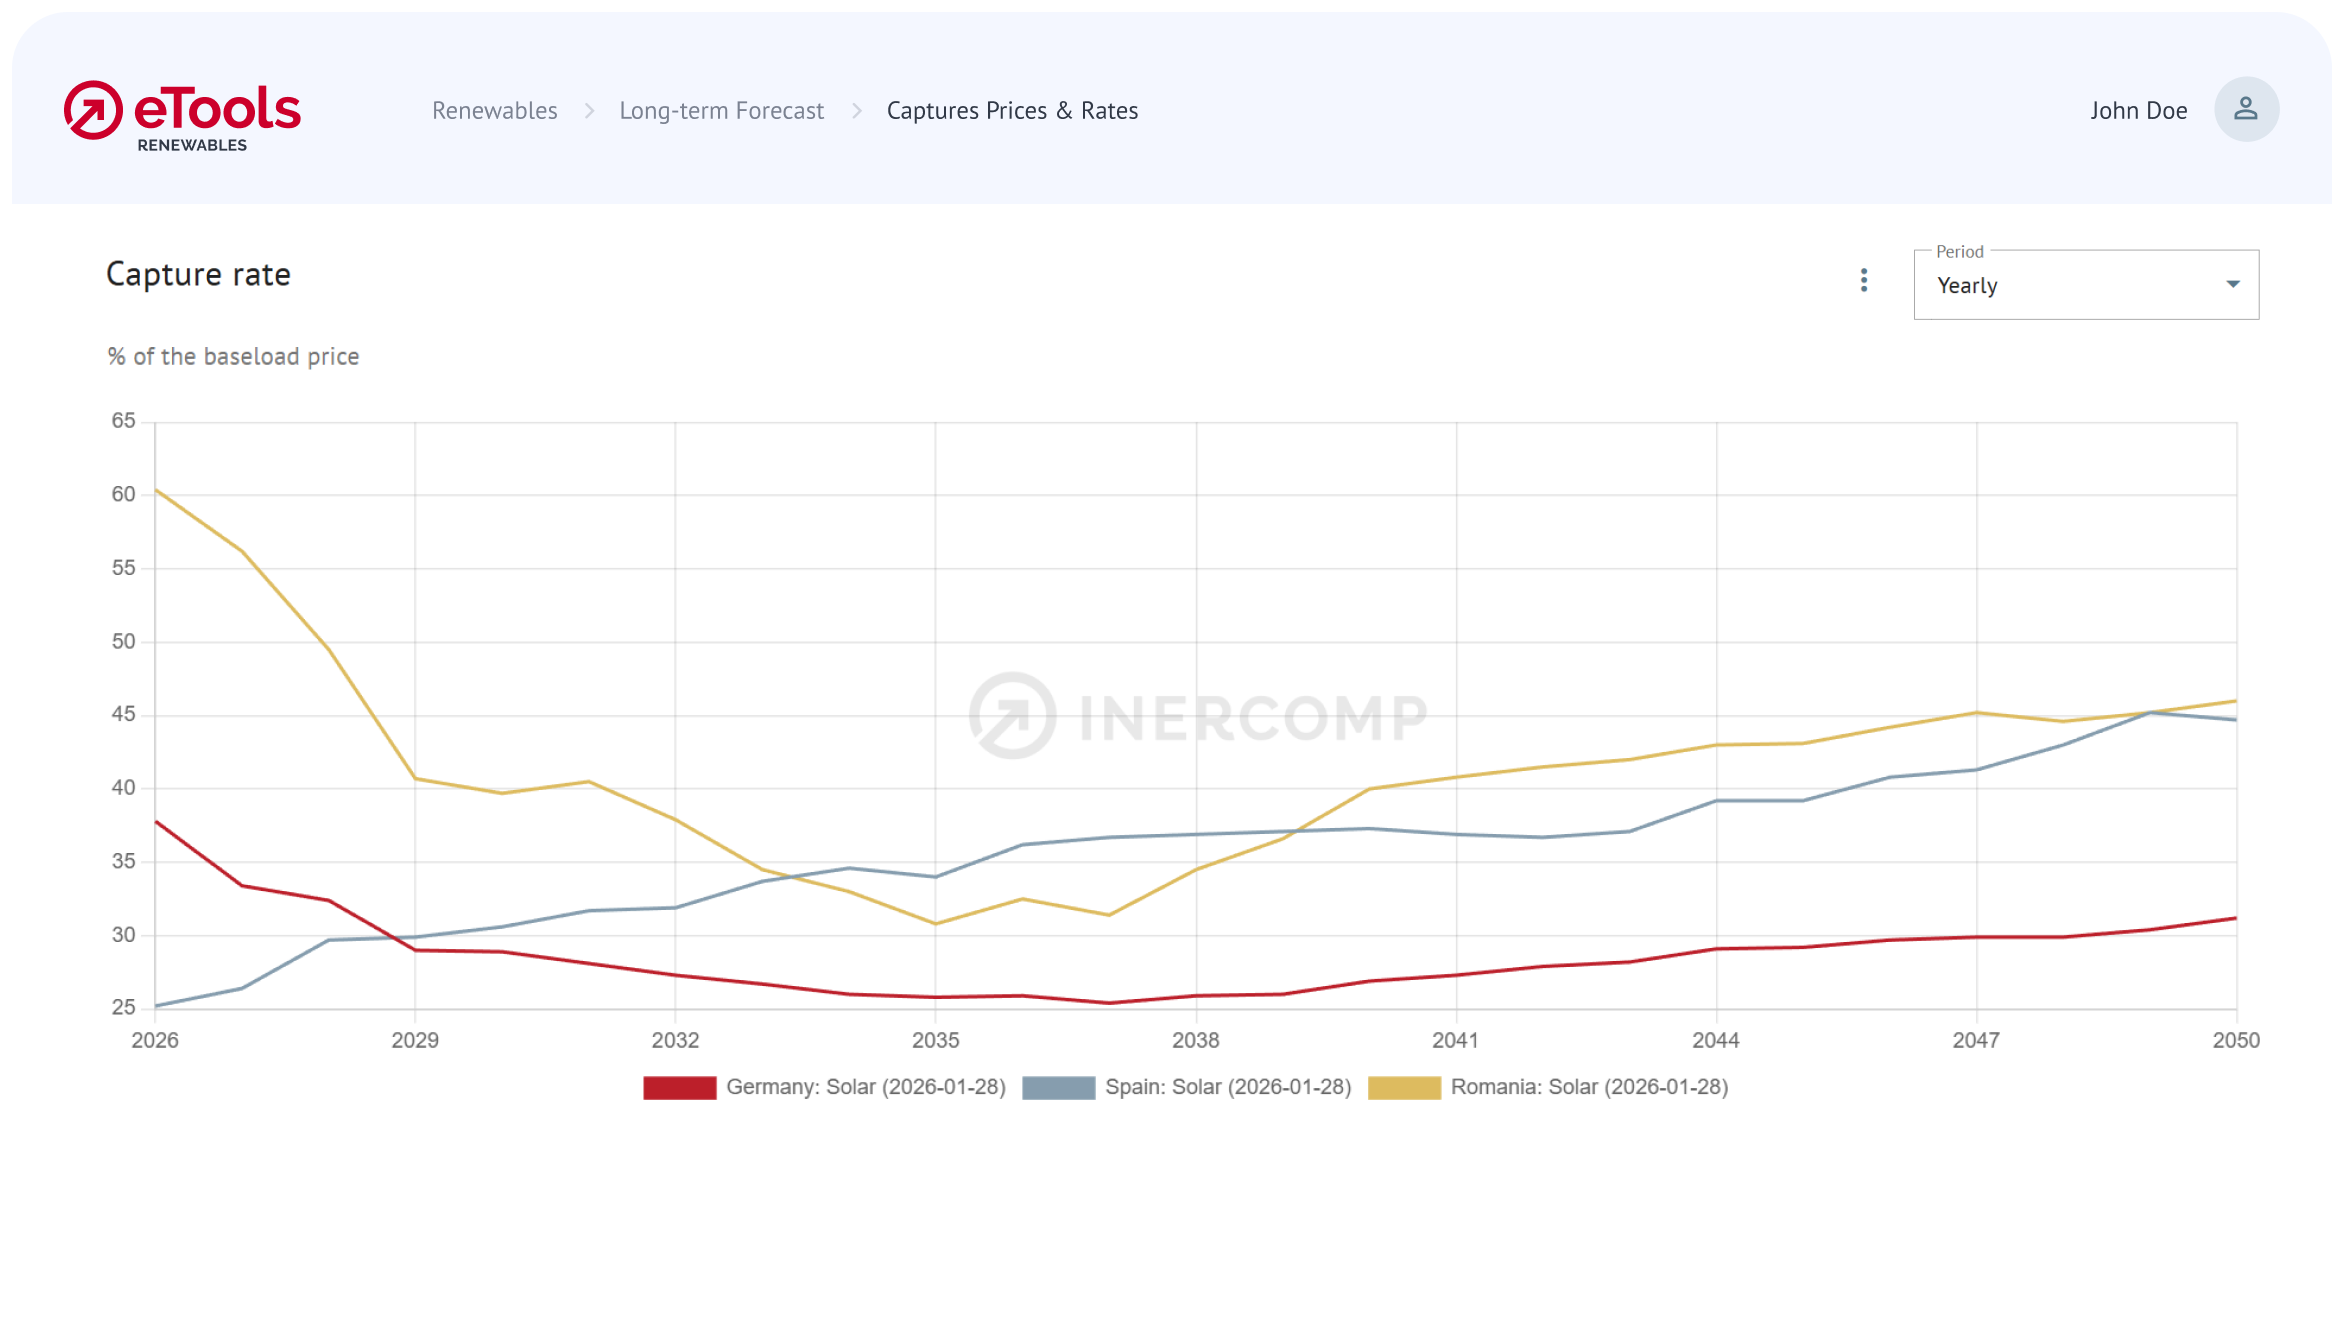
Forecast capture rates and revenues

Get today’s view of long-term capture rates, capture prices and market value for renewables across Europe. Use standard generation profiles or upload your own production profile. Then visualise results by country, market and time period, and export them.

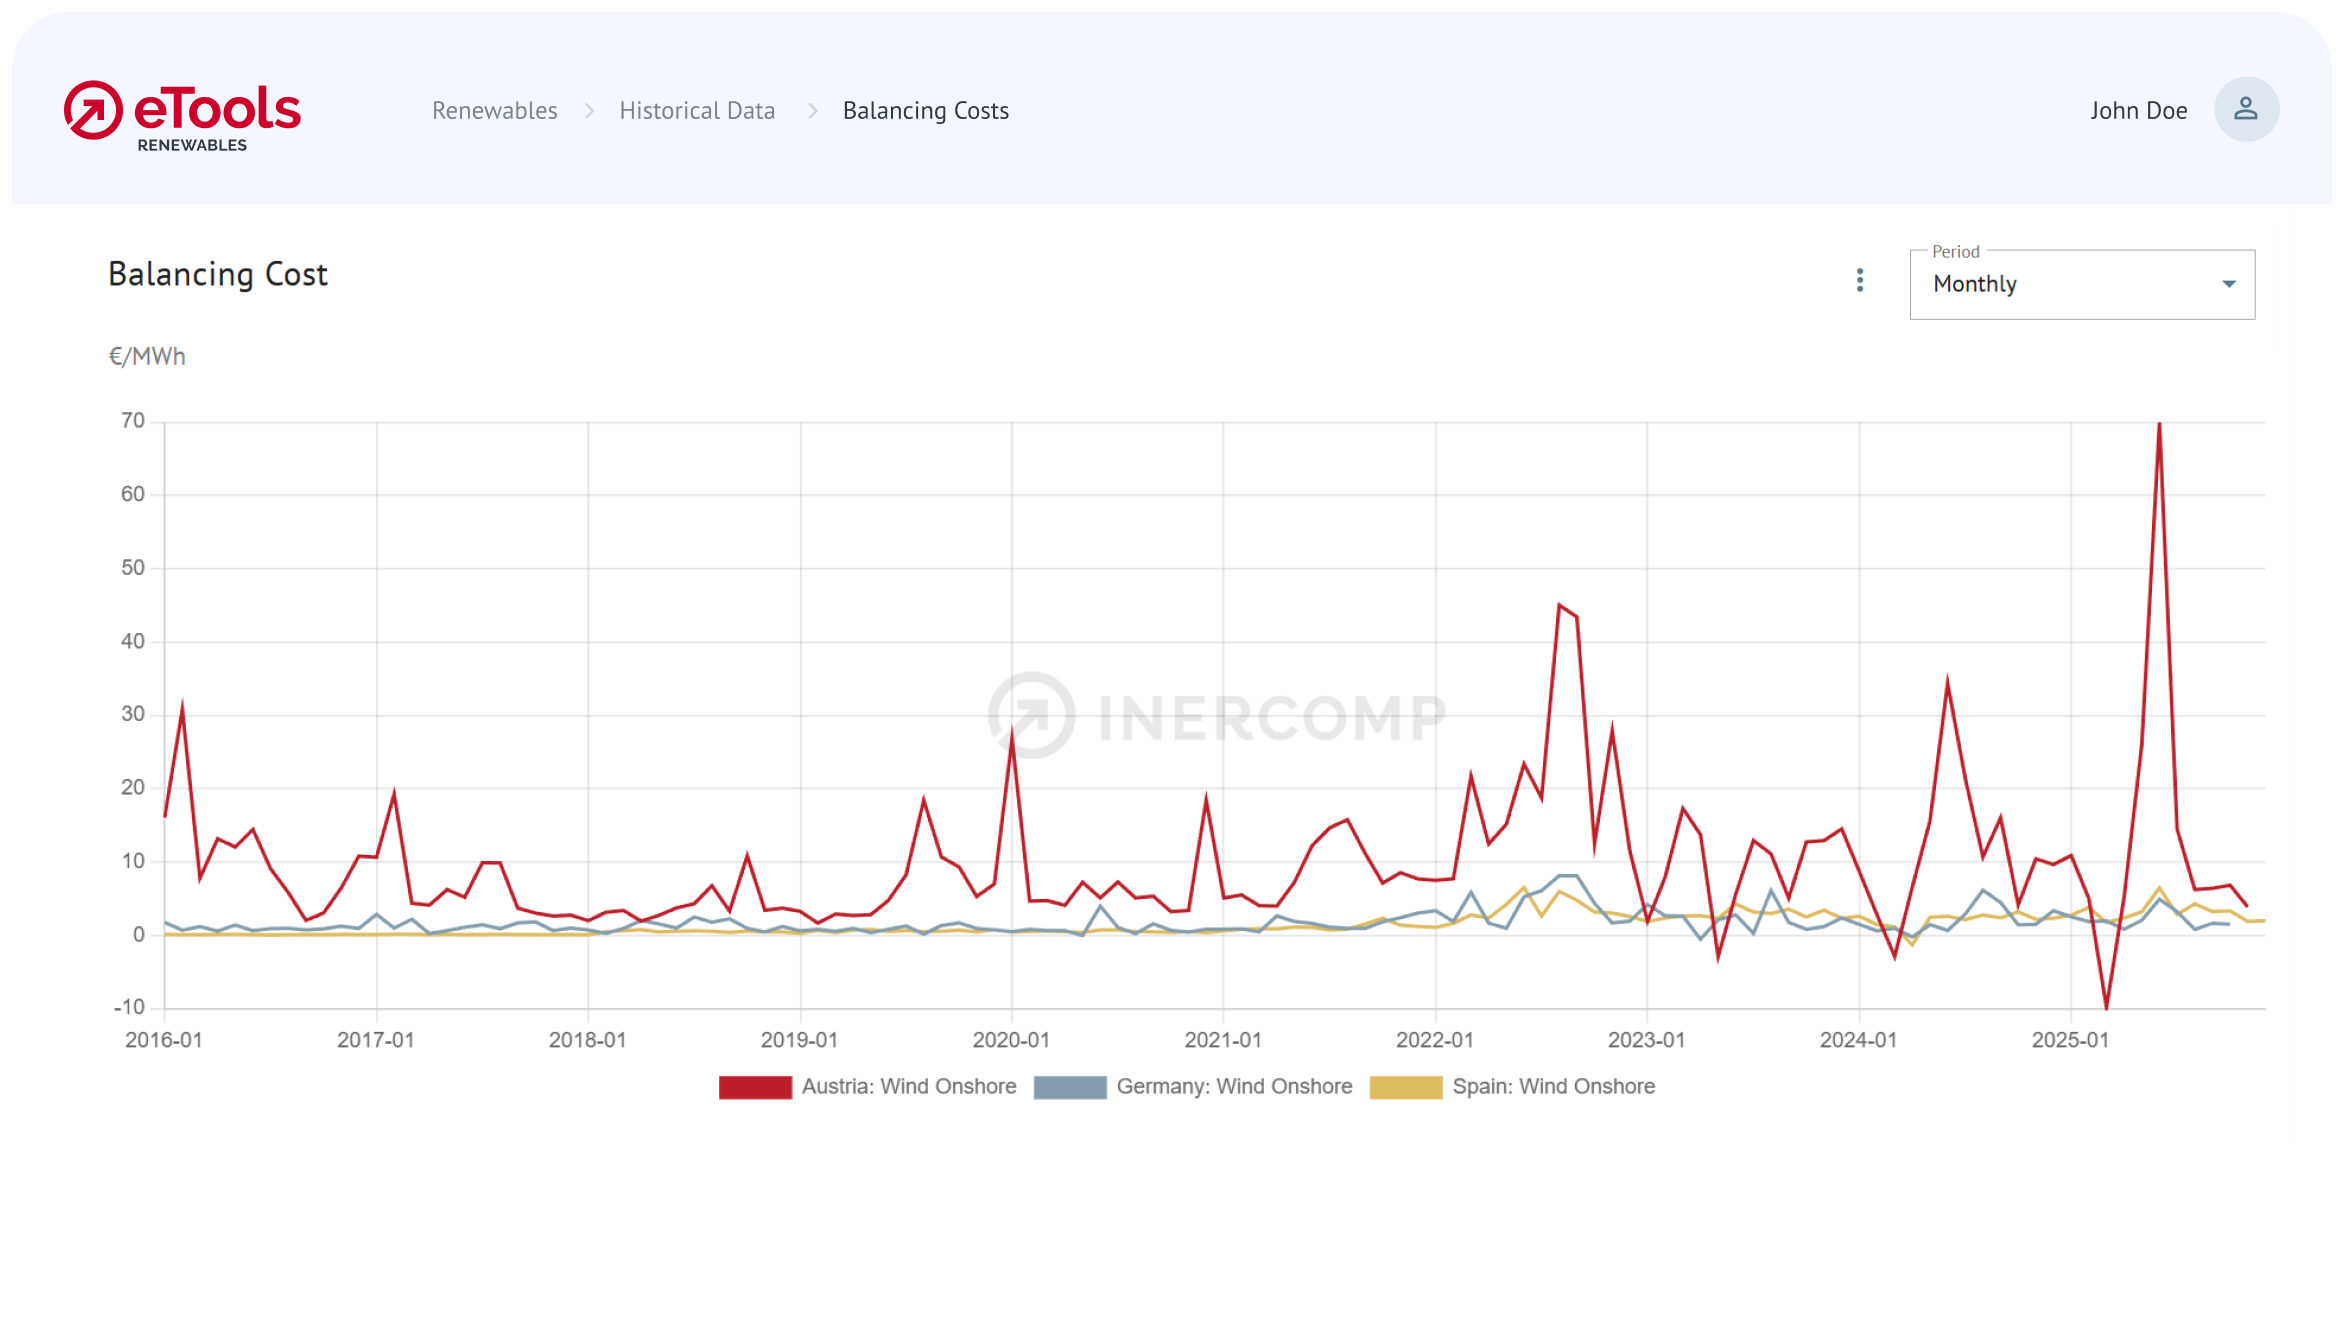
Benchmark balancing energy costs

Analyse and compare balancing energy cost benchmarks by technology and market. Identify patterns and draw clear conclusions about marketing and revenue risks.
2_Benchmark Balancing Energy Costs-Border
3_estimate negative-price exposure-Border

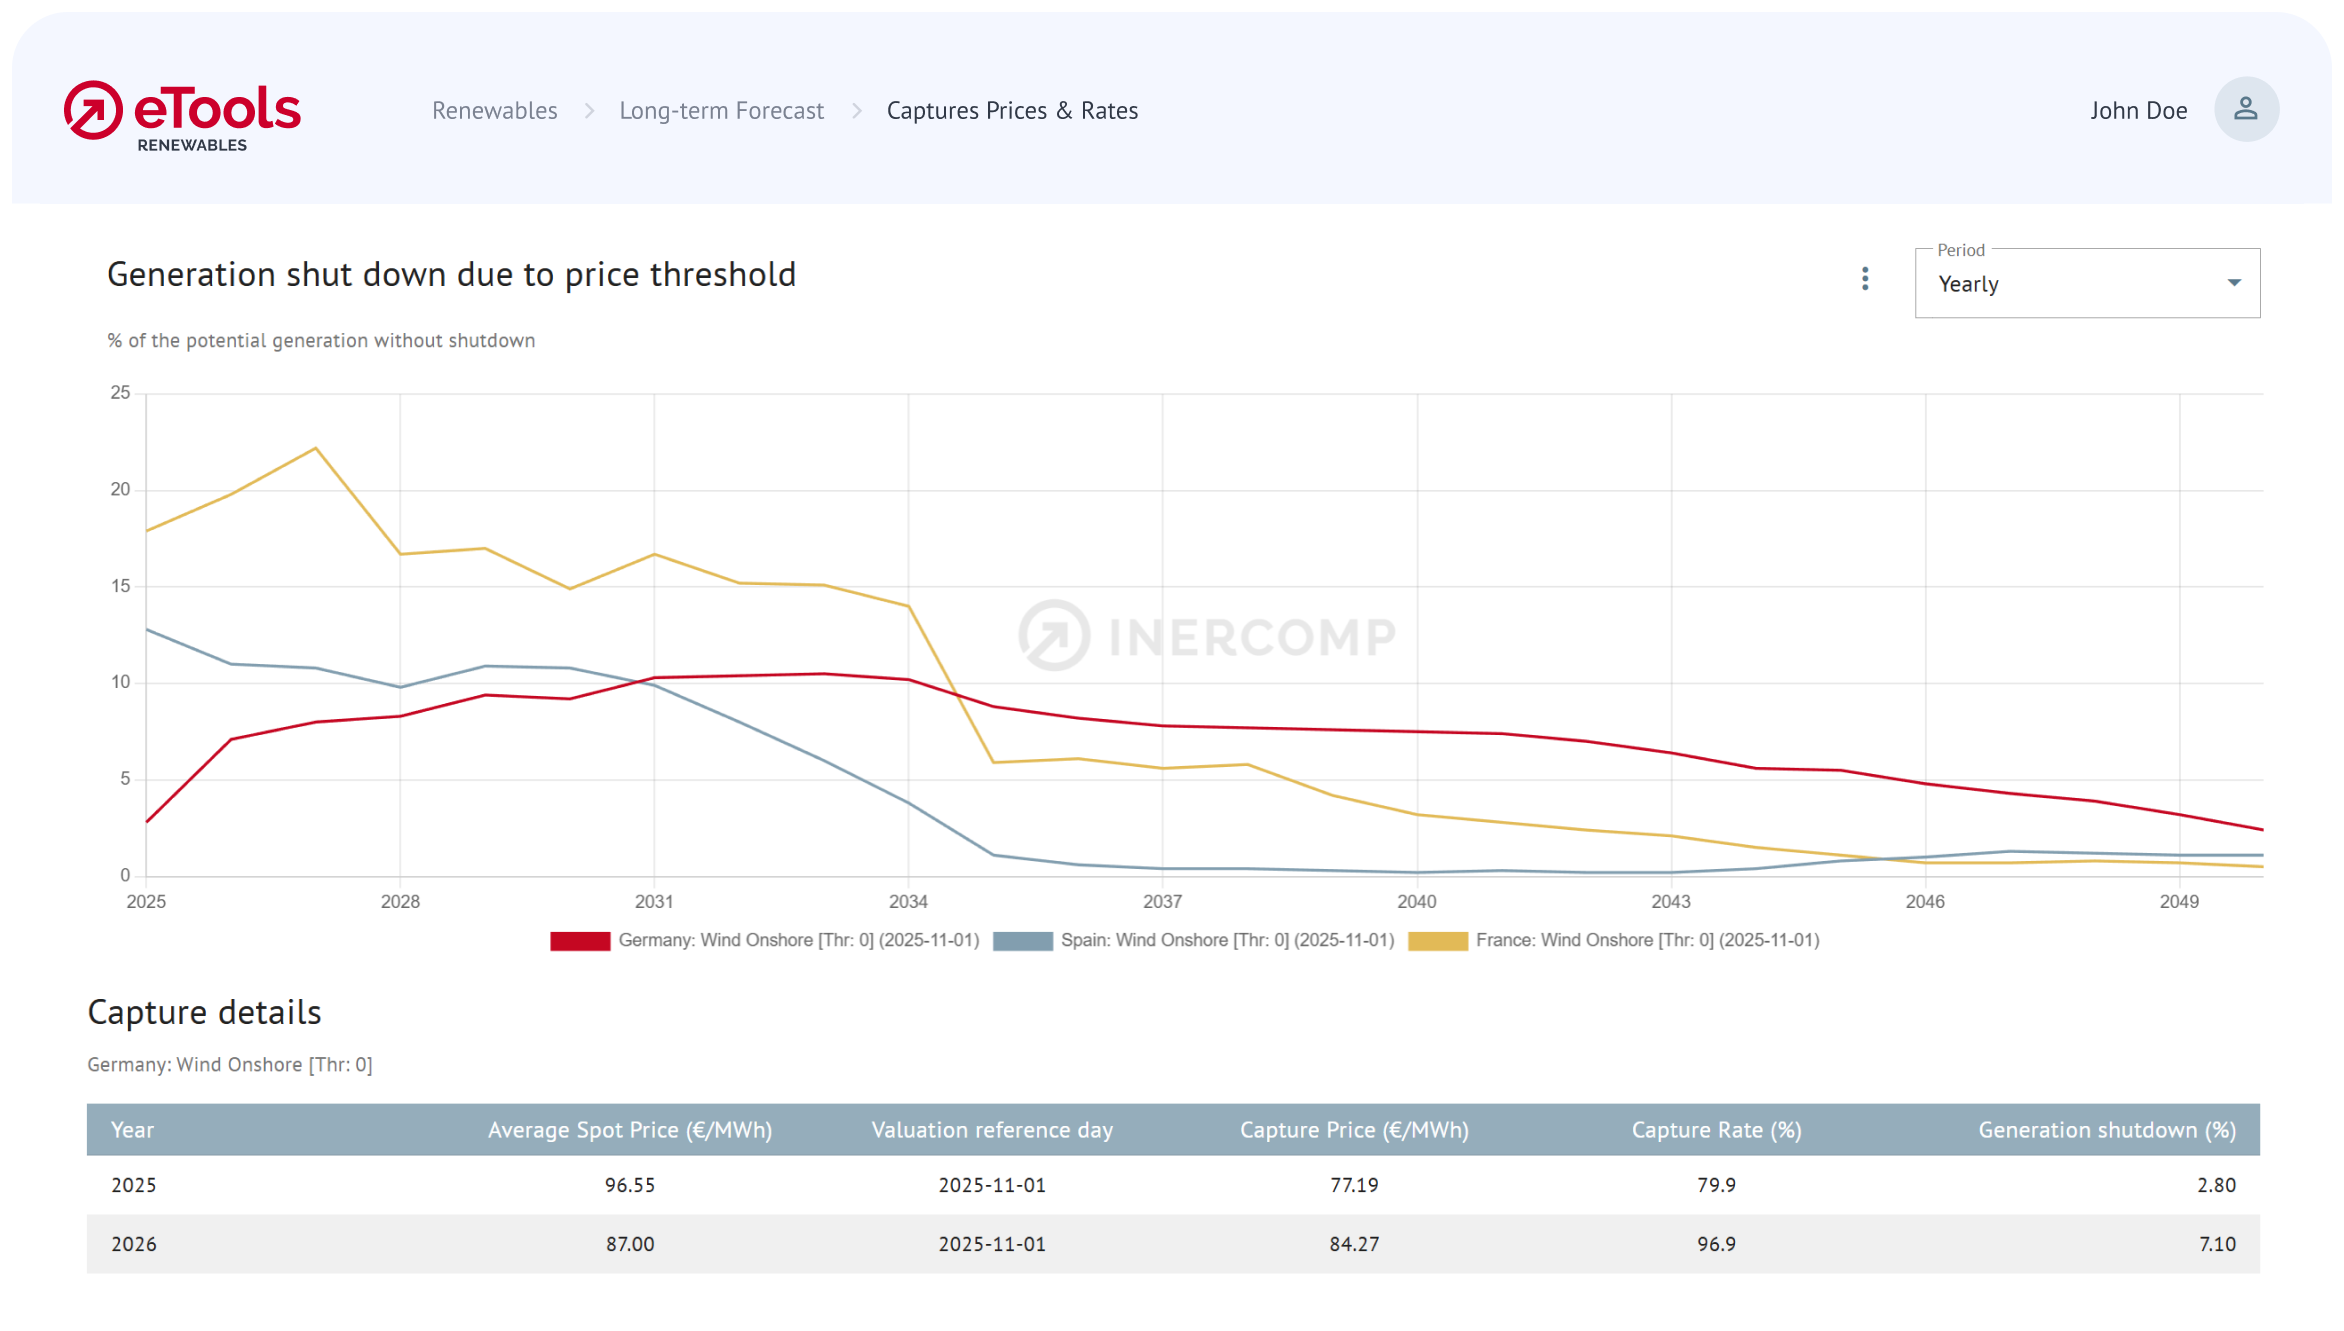
Quantify negative-price exposure

Negative prices are a major revenue risk for renewables. Estimate how much generation falls into negative-price hours - both historically and in future outlooks.

Assess specific projects

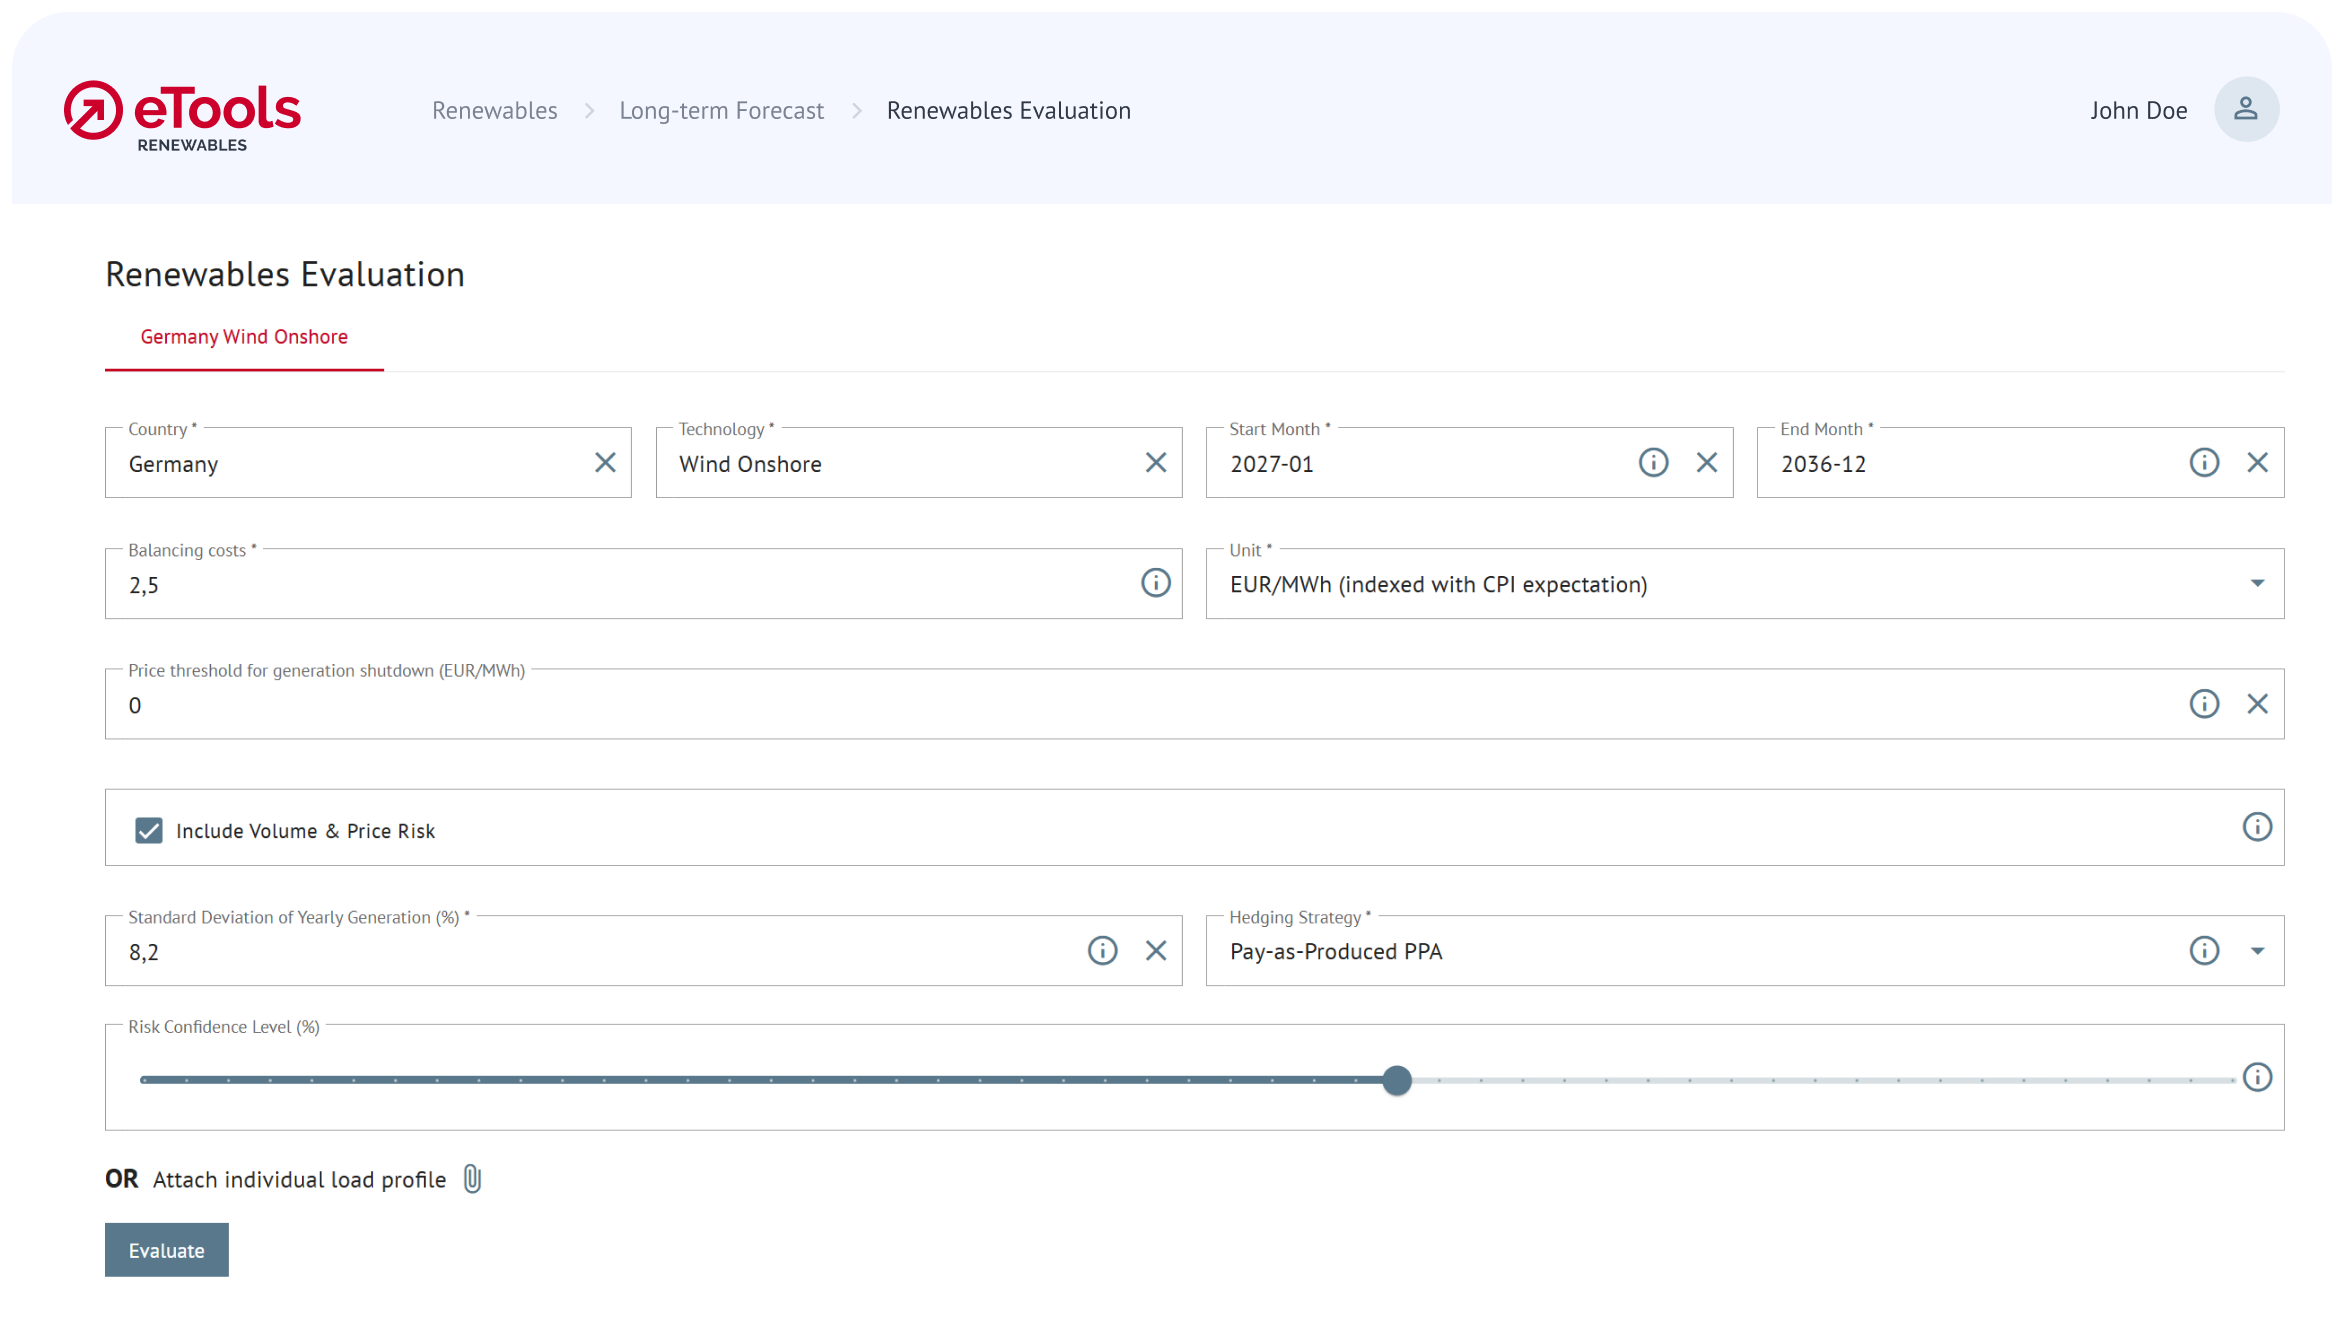
Model future revenues based on individual parameters such as duration, balancing energy costs and hedging strategy. See a transparent breakdown of revenue drivers and cost components over time.
4_Assess Individual Projects V1-Border
5_Evaluate and compare Corporate PPAs-Border

Evaluate and compare PPAs

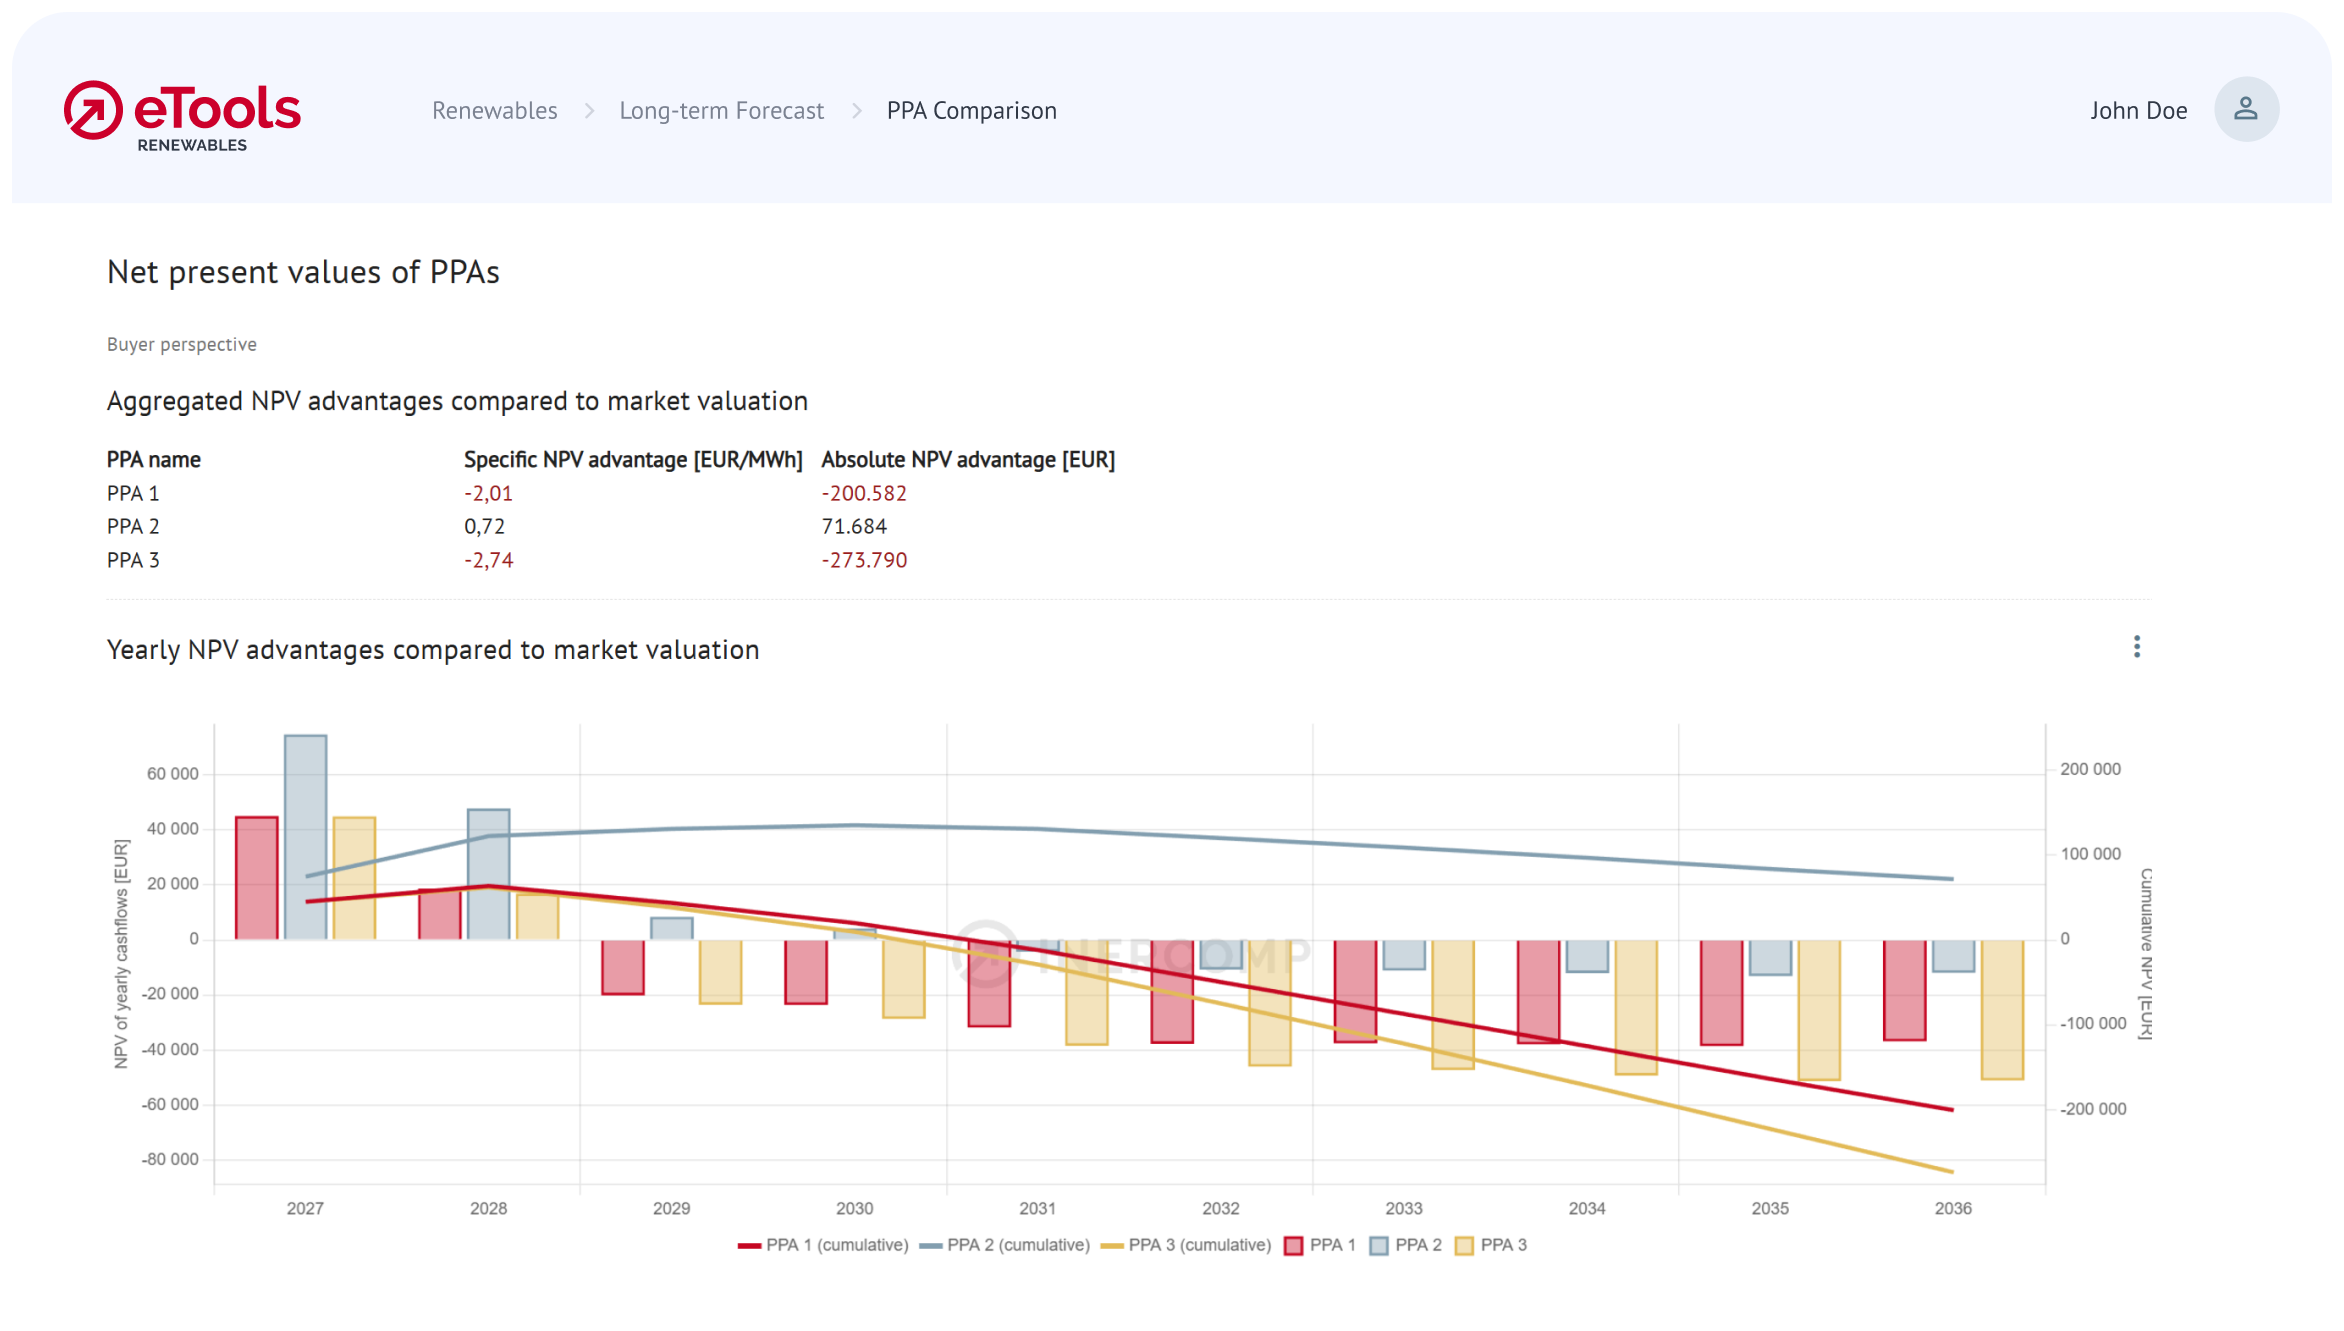
Define and compare multiple PPAs to find the most profitable deal. Calculate the NPV (net present value) based on market value, key risks and the contract duration.

Your benefits

Stand behind
every number

  • When finance, management or a counterparty challenges your assumptions, show where the value comes from and what changes it.
  • Because: it runs on the proven ICIS model and your own inputs.

Answer in an afternoon,
not a month

  • Value an asset or PPA the moment you need to. Don’t wait for a consultant or the next quarterly update.
  • Because: the data is updated daily and you can rerun calculations yourself, in your browser.

Compare and report on the same basis

  • Assess consistently, so your calculations and reports agree instead of contradicting each other.
  • Because: one method runs across every market and technology.

What makes eTools
Renewables different?

Fundamental model, up to 2050
Long term forecast, based on the recognized ICIS framework
Europe-wide, across technologies
Solar, onshore and offshore wind, and hydro - in 25+ European markets
Handles project complexity
Evaluates your individual project with your specific set of inputs
Software-as-a-service
Secure web platform with automatic updates and support

Ready for a deep dive?

Let’s discuss your use case and setup. See eTools examples and get answers to your questions in one session.

inercomp_etools_renewables_logo_RZ-rgb